
Buy AMZN
The Stock: Amazon.com Inc
The Ticker: AMZN
The Trade:
Trading options: BUY TO OPEN the January 20, 2023, CALL OPTION for AMZN at the $125 strike price (AMZN230120C00125000). Set a limit price for no more than $10. SELL IF you see a 50% loss.
Trading Shares: Buy shares of AMZN up to $125. Sell if AMZN drops below $102.
Buying and Holding Shares Long Term: Buy shares of AMZN up to $165.
My prediction in my most recent trade recommendation has so far been proving true.
In the last Dollar Trader alert I issued, I recommended buying put options on QQQ and then, after profiting, transitioning into buying QQQ outright.
The whole basis of that trade was an observation I made that I have not yet seen any other analyst make: Markets, but especially tech and growth stock indices, tend to do poorly before U.S. Federal Reserve meetings.
In the month following these meetings, however, these indices tend to see a nice “pop” in value.
Those options, if you purchased them, seem to have paid off quite well.
And if you had purchased QQQ at the very end of September? You’ve already seen a fairly impressive gain.
And I think this might be just the beginning.
As I’m discussing in my other newsletters, Living Rich Monthly and The Heritage Quarterly Report, I believe the market is setting up for another “bear market rally.”
A bear market rally is a period when stocks go up in value briefly during a broader period of decline.
That is, all the data and evidence seem to be pointing to stocks doing fairly well in October and November…
But then potentially struggling again in December and the first few months of 2023.
The reasons are fairly extensive. But they mainly have to do with the unique peculiarities of the financial world in these months.
September, for example, is a notoriously bad month for stock investors.
Across every September since 1985, the Nasdaq has averaged a loss of -0.9%. And across every September since 1952, the S&P 500 has averaged a loss of -0.7%.[1]
There are many theories why. My professional opinion is that, because many mutual funds and ETFs and companies end their fiscal years on September 30, many managers sell underperforming stocks. They do this so that they look better when it is time to issue annual documents that include a list of asset holdings and the performance of those holdings.
All this selling by huge institutional banks and funds quite naturally drives stock prices down.
But Octobers (and Novembers) are entirely different.
Across every October since 1985, the Nasdaq has averaged a gain of 1.4% (excluding 2008). And across every October since 1952, the S&P 500 has averaged a gain of 1.1% (excluding 2008).
October gains are bigger than September losses!
Why? Is it because these fund managers are piling back into the stocks they sold?
Here is my theory: The market is a “forward looking” entity. Stock prices over the short term tend to reflect investors’ short-term expectations and predictions.
That is a fancy, complicated way of saying something pretty asinine: “Stocks go up because people think stocks are going to go up.”
And in the final three months of the year, people tend to think stocks will go up because this is the period when companies — especially retail businesses — tend to generate the bulk of their revenue and profits.
Over the next few months, in America, we’re going to see Halloween, Thanksgiving, Christmas, and Hanukkah.
Four major holidays based around gift-giving and consumption.
That is, buying stuff. Something Americans are good at doing even if there’s a global economic recession.
We’re now at the point where the QQQ trade is almost finished.
After all: On October 3 and 4 alone, QQQ is up 4.82%.[2]
That’s over 3 times higher than the average gain for the entire month of October!
So we should soon begin to prepare to exit the QQQ trade and go where the money is expected to go for the next few months: retail and e-commerce.
And there is no bigger name in retail and e-commerce than Amazon.com (AMZN).
Amazon is an online retailer that has recently begun expanding into brick-and-mortar stores. Between Amazon’s inventory and independent sellers on their marketplace, Amazon sells about 350 million different products. Mainly this is to members of Amazon’s membership service, Amazon Prime, which has over 100 million subscribers who typically spend over $1,000 per year with Amazon.[3]
Amazon is the epitomic example of a growth stock.
To give you a sense of its astonishing growth, take a look at this chart showing Amazon’s annual revenue, their forecasted revenue, and their annual net income:[4]

Those vertical gray bars are economic recessions.
Which is to say, even economic slowdowns have not slowed down Amazon’s meteoric growth.
This has led to Amazon gaining the dominant share of consumer spending in recent years, topping its biggest competitor, Walmart.[5]

That’s all retail spending, though. The gap is even wider when you look at the share these companies have of e-commerce sales.[6]
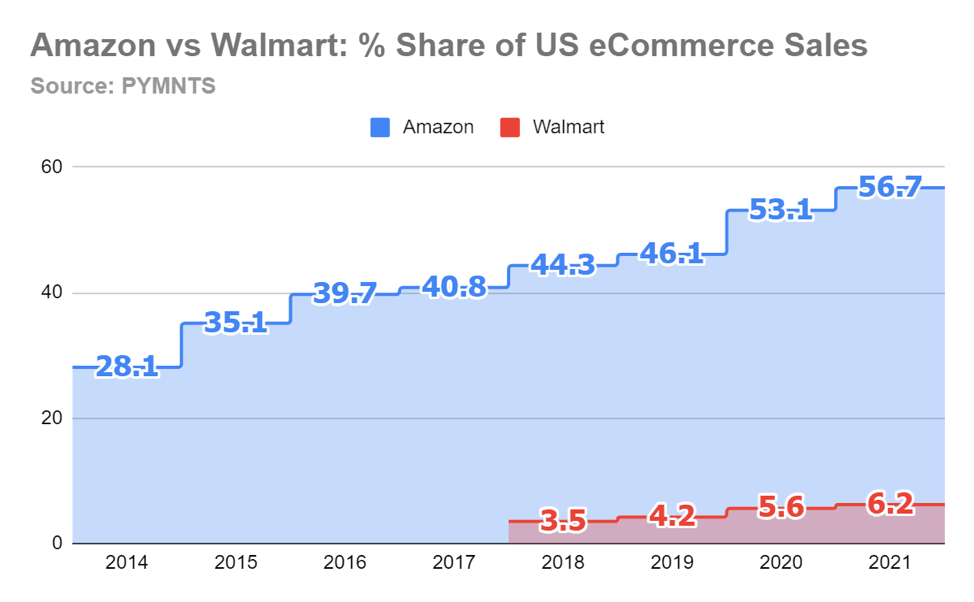
Nearly 60% of all online retail purchases in the U.S. were done on Amazon.com last year.
Honestly, with this kind of market dominance, Amazon would be a worthy candidate for the Heritage Jr. portfolio if the company exited “growth mode” and stabilized its cash flow.
Now, all of that makes Amazon a compelling company. But investors might worry that the stock price will decline in the coming months — especially if there’s a worldwide recession.
Here’s the compelling investment thesis I’m seeing for Amazon at the moment.
In 2022, the stock price has already diverged quite a lot from its fundamentals. And when this has happened after past recessions? Amazon has gone on to produce extraordinary gains for investors both in the short and long term.
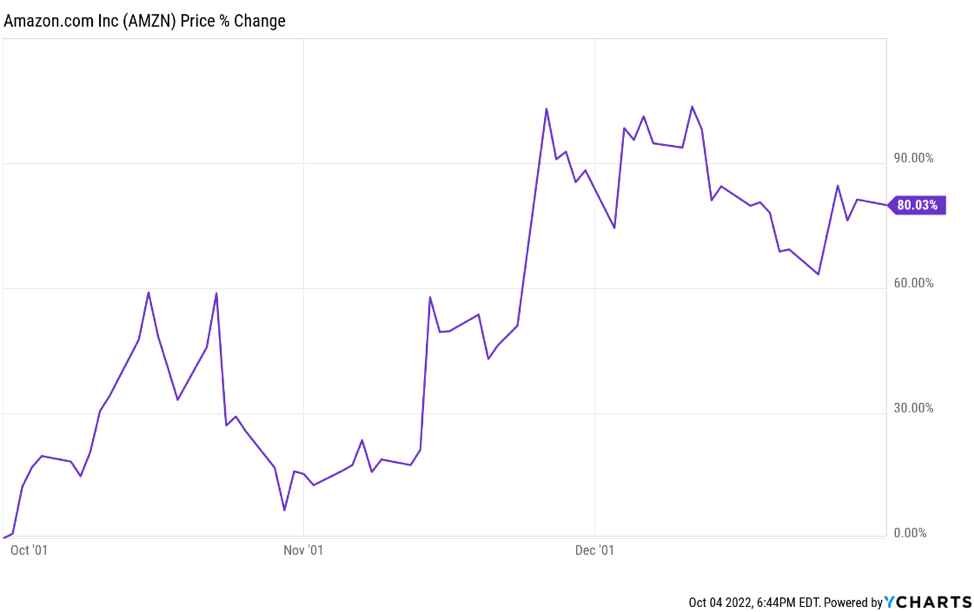
Consider the big recession following the tech bubble collapse, which lasted from March 2001 to November 2001.
Even during a bear market. Even following a recession. Even after Amazon’s unbelievable price drop at the time…
Amazon gained about 80% between October 1, 2001, and January 1, 2002.[7]
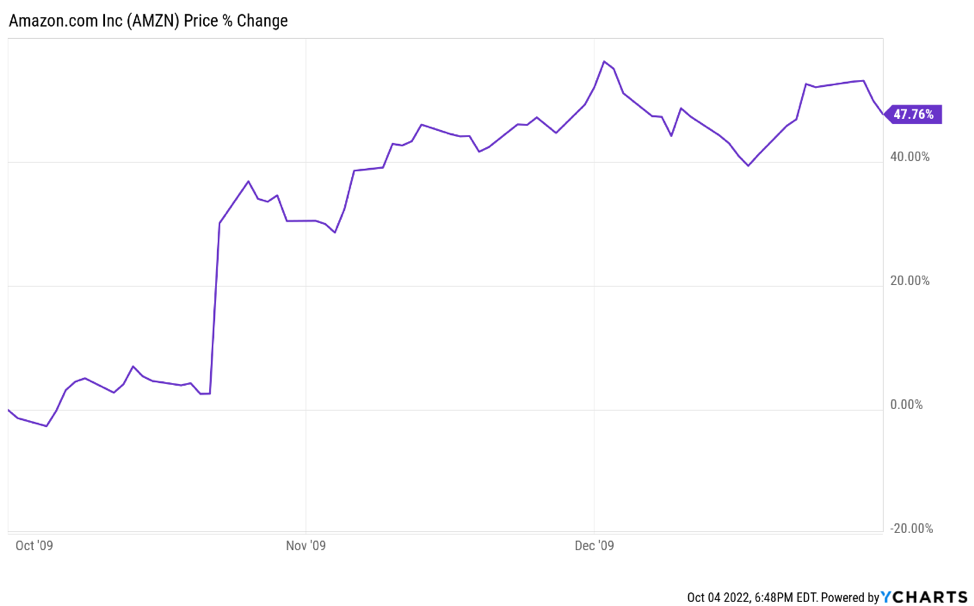
And what about the Great Recession from 2007 to 2009?
Investors were still rattled from one of the most severe crashes in stock market history.
But that didn’t matter: Amazon gained about 48% between October 1, 2009, and January 1, 2010.[8]
This pattern holds true for the period following the recession in 2020 as well, but the gain was only 1.1% that year.
In fact, I looked at every October to January period for Amazon since 2001 — the period I just described above as being the pinnacle of American commerce.
Many of Amazon’s best gains over the last 20 years followed two simple events:
A big drawdown of -10% or more between January 1 and September 30.
October 1.
I quickly put together a backtest of this strategy, showing the gains you would have seen had you simply bought on these two conditions and held:[9]

Are you starting to see why I think Amazon looks like an amazing opportunity both in the short term and long term right now?
Had you simply waited for a big downturn for the first 9 months of the year… then bought right at the beginning of the holiday season…
You would have made absolutely extraordinary gains.
Every single time.
Now, we can’t rely on past performance to predict future results.
But so far, in 2022, this pattern is holding true yet again.
And that’s why I’m recommending Amazon both as a short-term trade and as a long-term “Buy and Hold,” depending on how you wish to play this stock.
If you’re looking for potentially quicker gains? I’ve recommended both an option and an attractive buy-up-to price for shares, as well as instructions for what to do in the coming months.
But if you’re like me, and Amazon looks like an attractive buy-and-hold kind of growth stock right now?
You can simply buy shares and hold on to them for the long term.
The choice is yours.
Company Info:
Amazon is a leading online retailer and one of the highest-grossing e-commerce aggregators, with $386 billion in net sales and approximately $578 billion in estimated physical/digital online gross merchandise volume in 2021. Retail-related revenue represents approximately 80% of the total, followed by Amazon Web Services' cloud computing, storage, database, and other offerings (10%-15%), advertising services (5%), and other. International segments constitute 25%-30% of Amazon's non-AWS sales, led by Germany, the United Kingdom, and Japan.[10]
Key Stats:
Market Cap: $1,617,218,460,000
HQ: United States
Sector: Consumer Cyclical
Industry: Internet Retail
Exchange: NASDAQ
Relevant Company Financials:
While Amazon’s ROE and profit margin have dipped in 2022, the company still continues to be astoundingly profitable, and their revenue growth is practically unmatched.


[3] https://www.repricerexpress.com/amazon-statistics/
[4] https://tinyurl.com/mwy5pwa3
[5] https://www.pymnts.com/news/retail/2022/new-pymnts-data-shows-amazon-now-ahead-of-walmart-in-share-of-retail-spending/
[6] https://www.pymnts.com/news/retail/2022/amazons-share-of-us-ecommerce-sales-hits-all-time-high-of-56-7-in-2021/
[7] https://tinyurl.com/yk7ps4kf
[8] https://tinyurl.com/2p9bm8tr
[9] https://docs.google.com/spreadsheets/d/1nJh90MHHALRY9agMDhTahEaYLvvF7eOW/edit?usp=sharing&ouid=116526248446407229619&rtpof=true&sd=true
[10] https://ycharts.com/companies/AMZN
[11] https://ycharts.com/companies/AMZN/revenues_ttm
[12] https://ycharts.com/companies/AMZN/profit_margin_ttm
[13] https://ycharts.com/companies/AMZN/return_on_equity
[14] https://ycharts.com/companies/AMZN/normalized_eps_ttm
[15] https://ycharts.com/companies/AMZN/debt_equity_ratio